Country
Finland
Based on OECD Taxing Wages (2025 data), this page compares Finland's modeled income tax, employee contributions, and take-home pay across the salary levels below. It is a standardized cross-country comparison, not a personal tax return, local tax quote, or average-income estimate.
Currency: EUR (Euro)
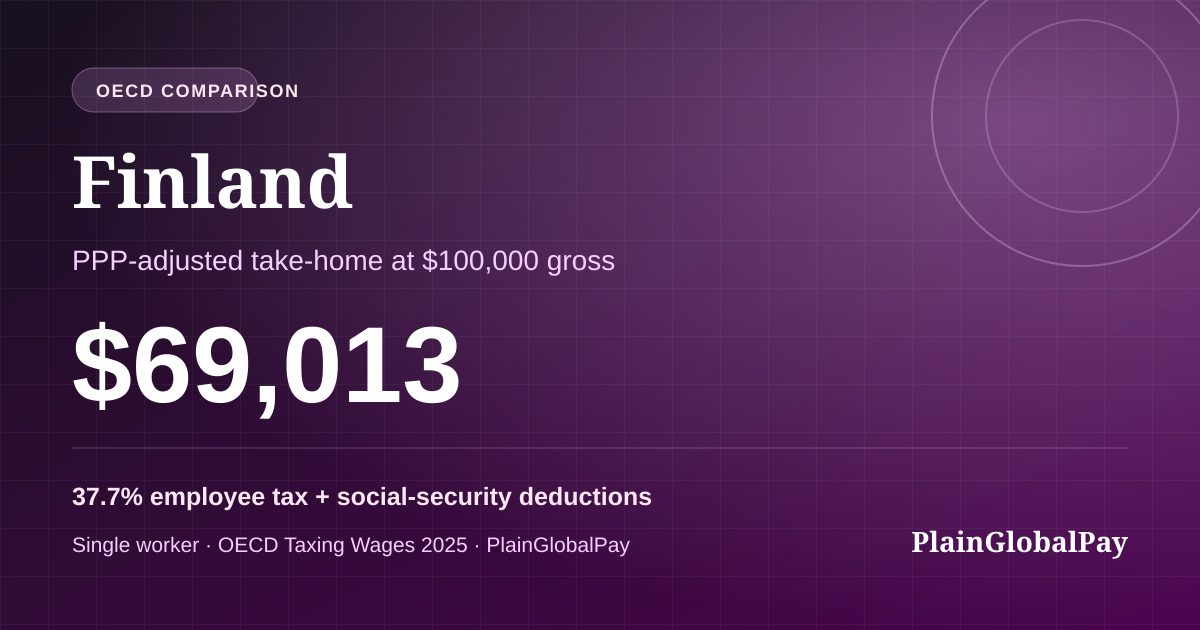
A $100,000 salary in Finland returns about $62,258 in annual take-home pay after employee tax and social-security deductions of 37.7%.
Adjusted for purchasing power, that take-home is worth $69,013 in real terms, ranking Finland #32 of 38 OECD countries (below the OECD average of $96,699). The effective income-tax rate is 28.2%. Figures from OECD Taxing Wages (2025 data) and the OECD PPP.
On PPP-adjusted take-home pay at a $100K gross salary, Finland ranks #32 of 38 OECD countries, higher than 16% of them. It sits below the OECD average of $96,699.
Finland plotted alongside other Europe OECD countries on the PlainGlobalPay wage matrix. Horizontal axis is the country's combined employee tax and social-security deductions; vertical axis is PPP-adjusted net pay at $100K gross.
Country
Finland
Tax-data year
2025
Source
OECD
After income tax and employee social security contributions in Finland.
USD, after income tax + employee SSC
The $100,000 gross splits into take-home pay, income tax, and employee social security contributions.
Single, no children · OECD Taxing Wages (2025 data)
| Gross (USD) | Net (USD) | PPP-Adj Net | Eff. Tax Rate | Employee tax + SSC |
|---|---|---|---|---|
| $20,000 | $15,475 | $17,154 | 13.1% | 22.6% |
| $30,000 | $23,212 | $25,731 | 13.1% | 22.6% |
| $40,000 | $30,950 | $34,308 | 13.1% | 22.6% |
| $50,000 | $37,181 | $41,215 | 16.1% | 25.6% |
| $60,000 | $42,285 | $46,873 | 20.0% | 29.5% |
| $70,000 | $47,577 | $52,739 | 22.5% | 32.0% |
| $80,000 | $52,851 | $58,586 | 24.4% | 33.9% |
| $90,000 | $57,745 | $64,010 | 26.3% | 35.8% |
| $100,000reference | $62,258 | $69,013 | 28.2% | 37.7% |
| $110,000 | $67,375 | $74,685 | 29.2% | 38.8% |
| $120,000 | $73,500 | $81,475 | 29.2% | 38.8% |
| $130,000 | $79,625 | $88,264 | 29.2% | 38.8% |
| $140,000 | $85,750 | $95,054 | 29.2% | 38.8% |
| $150,000 | $91,875 | $101,843 | 29.2% | 38.8% |
| $160,000 | $91,875 | $101,843 | 33.0% | 42.6% |
| $170,000 | $92,049 | $102,036 | 36.3% | 45.9% |
| $180,000 | $95,487 | $105,848 | 37.4% | 47.0% |
| $190,000 | $98,706 | $109,416 | 38.5% | 48.0% |
| $200,000 | $101,706 | $112,741 | 39.6% | 49.1% |
| $210,000 | $104,485 | $115,822 | 40.7% | 50.3% |
| $220,000 | $107,045 | $118,660 | 41.8% | 51.3% |
| $230,000 | $109,386 | $121,254 | 42.9% | 52.4% |
| $240,000 | $111,507 | $123,605 | 44.0% | 53.5% |
| $250,000 | $113,408 | $125,713 | 45.1% | 54.6% |
| $260,000 | $115,090 | $127,577 | 46.2% | 55.7% |
| $270,000 | $116,552 | $129,198 | 47.3% | 56.8% |
| $280,000 | $117,795 | $130,576 | 48.4% | 57.9% |
| $290,000 | $121,413 | $134,587 | 48.6% | 58.1% |
| $300,000 | $125,600 | $139,228 | 48.6% | 58.1% |
Local currency per 1 USD PPP – OECD PPP
| Year | PPP Factor | Exchange Rate | Price Level Index |
|---|---|---|---|
| 1960 | 0.3820 | N/A | 71.0 |
| 1961 | 0.3985 | N/A | 74.0 |
| 1962 | 0.4051 | N/A | 75.3 |
| 1963 | 0.4198 | N/A | 78.0 |
| 1964 | 0.4420 | N/A | 82.1 |
| 1965 | 0.4516 | N/A | 83.9 |
| 1966 | 0.4570 | N/A | 84.9 |
| 1967 | 0.4769 | N/A | 82.2 |
| 1968 | 0.5097 | N/A | 72.2 |
| 1969 | 0.5047 | N/A | 71.4 |
These links use the same OECD single-worker model at a $100K gross salary, not geographic proximity or a recommendation.
Finland's tax system shapes the real value of every paycheck earned in the country. At a $100K USD equivalent salary, workers keep $62,258 after income tax and social security contributions, but when adjusted for local purchasing power, that take-home pay is worth $69,013 in US dollar terms. With a top marginal income tax rate of 56.9%, a VAT/GST rate of 25.5%, the total cost of employment and the net benefit to workers varies significantly compared to other OECD nations. Use the calculator above to model your own salary scenario.
At a $100K gross salary, Finland delivers $69,013 in PPP-adjusted take-home pay - $27,686 below the OECD average of $96,699. The nominal net figure of $62,258 understates or overstates what that salary actually buys because a dollar in Finland is not worth a dollar in the United States. The current PPP factor of 0.834 and price level index of 90.2 (US = 100) are the conversion mechanics that translate nominal pay into real living-standard units.
The top marginal income tax rate of 56.9% is only part of the picture, effective rates on typical salaries are much lower because of bracket progression, personal allowances, and family credits. At $100K, the effective income tax rate is 28.2% and employee tax plus social-security deductions are 37.7%. Employer-side social contributions add a layer of cost that does not appear on pay stubs but shifts the total cost of employment. On the spending side, a VAT/GST rate of 25.5% further reduces what each after-tax dollar ultimately purchases.
Compared to a US worker at the same $100K salary keeping $74,598 in PPP-adjusted terms, Finland delivers less real purchasing power per dollar of gross pay. The national average annual wage in Finland sits at $63,053 in PPP-adjusted US dollars, giving a baseline for how a $100K offer compares to typical local compensation, a premium or a discount depending on the market. The table of take-home pay and PPP factor history above shows how these forces have moved over time and at every salary level, so expat workers, remote employees, and employers can size a specific offer against the structural realities of Finland's tax and price landscape.
Step-by-step guide to using PPP for accurate salary comparison across countries.
Data-driven ranking of OECD countries by effective income tax burden and real take-home pay.
What the 15% global minimum corporate tax means for workers, companies, and countries.
Reuse the source-bounded OECD comparison card with a visible PlainGlobalPay attribution. The card is not personal tax advice.
Preview the embeddable cardDisclaimer: This information is provided for informational purposes only and does not constitute professional advice. Data is sourced from the OECD Taxing Wages database. Consult a qualified professional before making decisions based on this data.