🇺🇸
OECD Taxing Wages (2025 data) PPP-adjusted OECD

United States

Based on OECD Taxing Wages (2025 data), this page compares United States's modeled income tax, employee contributions, and take-home pay across the salary levels below. It is a standardized cross-country comparison, not a personal tax return, local tax quote, or average-income estimate.

North America • USA

Currency: USD (US Dollar)

Open Calculator Compare with USA
Country
United States
North America
Avg. Annual Wage
$86,977
PPP-adjusted
Employee deductions
25.4%
at $100K income
Take-Home vs US
$74,598 PPP
per $100K gross
PPP Factor
1.000
2024 OECD PPP

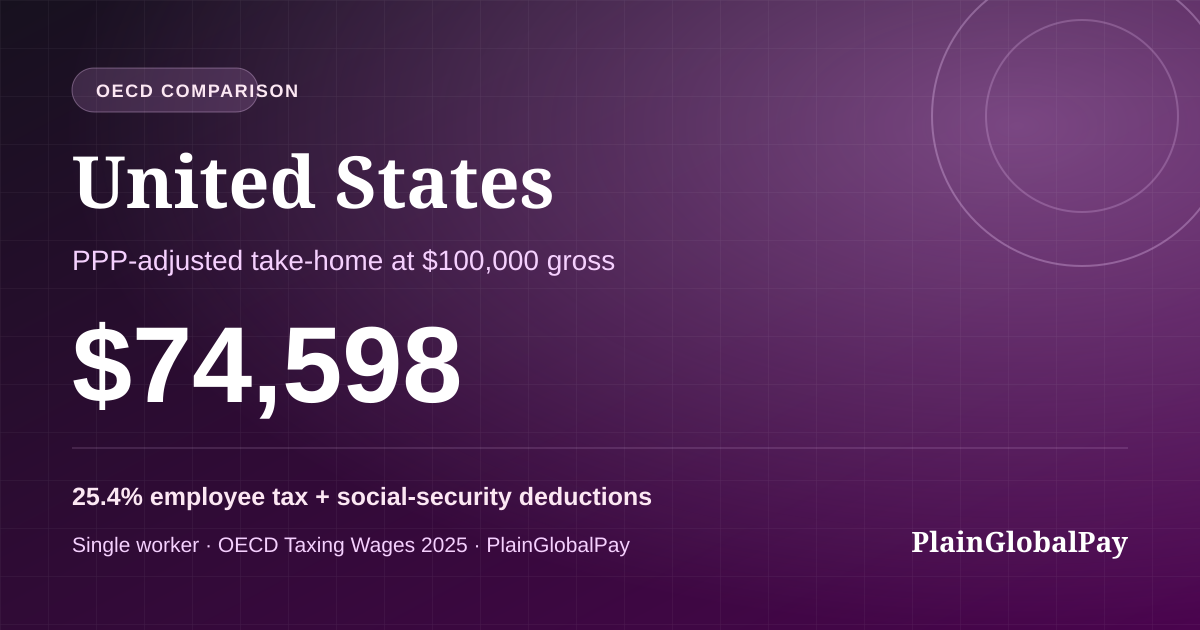
A $100,000 salary in United States returns about $74,598 in annual take-home pay after employee tax and social-security deductions of 25.4%.

Adjusted for purchasing power, that take-home is worth $74,598 in real terms, ranking United States #30 of 38 OECD countries (below the OECD average of $96,699). The effective income-tax rate is 17.8%. Figures from OECD Taxing Wages (2025 data) and the OECD PPP.

Gross $100K → Net
$74,598
Above OECD average
After income tax & SSC
PPP-Adjusted Net
$74,598
Below OECD average
Real purchasing power in USD
Effective Tax Rate
17.8%
Below OECD average
Income tax only
Employee tax + SSC
25.4%
Below OECD average
Income tax + employee SSC

Where United States ranks among the OECD

On PPP-adjusted take-home pay at a $100K gross salary, United States ranks #30 of 38 OECD countries, higher than 21% of them. It sits below the OECD average of $96,699.

lowest $59,682 United States highest $227,332

United States in Its Region

United States plotted alongside other North America OECD countries on the PlainGlobalPay wage matrix. Horizontal axis is the country's combined employee tax and social-security deductions; vertical axis is PPP-adjusted net pay at $100K gross.

United States (highlighted) against its North America OECD peers, split by the region-average employee tax-and-SSC deduction rate (27.9%) and PPP take-home, which quadrant a country lands in tells you whether lower employee deductions, high purchasing power, or both are doing the work.

Low tax · high real payHigh tax · high real payLow tax · low real payHigh tax · low real pay25.226.327.528.629.772472.184164.895857.5107550.2119242.9Tax wedge (% of gross)PPP take-home at $100K (USD)USACANMEX
United States (highlighted) against its North America OECD peers, split by the region-average employee tax-and-SSC deduction rate (27.9%) and PPP take-home, which quadrant a country lands in tells you whether lower employee deductions, high purchasing power, or both are doing the work.

Country

United States

Tax-data year

2025

Source

OECD

Take-home percentage at $100K 74.6%

After income tax and employee social security contributions in United States.

Net take-home pay by salary in United States

USD, after income tax + employee SSC

$20k$16k$30k$24k$40k$31k$50k$39k$60k$47k$70k$54k$80k$61k$90k$68k$100k$75k$110k$81k$120k$88k$130k$94k

Where a $100,000 salary goes in United States

The $100,000 gross splits into take-home pay, income tax, and employee social security contributions.

Take-home $74,598 Income tax $17,751 Employee SSC $7,651

Take-Home Pay at Every Salary Level

Single, no children · OECD Taxing Wages (2025 data)

Gross (USD) Net (USD) PPP-Adj Net Eff. Tax Rate Employee tax + SSC
$20,000 $15,710 $15,710 13.8% 21.4%
$30,000 $23,565 $23,565 13.8% 21.4%
$40,000 $31,420 $31,420 13.8% 21.4%
$50,000 $39,275 $39,275 13.8% 21.4%
$60,000 $47,027 $47,027 14.0% 21.6%
$70,000 $54,166 $54,166 15.0% 22.6%
$80,000 $61,106 $61,106 16.0% 23.6%
$90,000 $67,890 $67,890 16.9% 24.6%
$100,000reference $74,598 $74,598 17.8% 25.4%
$110,000 $81,138 $81,138 18.6% 26.2%
$120,000 $87,512 $87,512 19.4% 27.1%
$130,000 $93,719 $93,719 20.3% 27.9%
$140,000 $99,758 $99,758 21.1% 28.7%
$150,000 $106,226 $106,226 21.5% 29.2%
$160,000 $113,307 $113,307 21.5% 29.2%
$170,000 $120,389 $120,389 21.5% 29.2%
$180,000 $127,471 $127,471 21.5% 29.2%
$190,000 $134,553 $134,553 21.5% 29.2%
$200,000 $141,634 $141,634 21.5% 29.2%
$210,000 $148,716 $148,716 21.5% 29.2%
$220,000 $148,716 $148,716 24.8% 32.4%
$230,000 $148,716 $148,716 27.7% 35.3%
$240,000 $151,159 $151,159 29.4% 37.0%
$250,000 $155,390 $155,390 30.2% 37.8%
$260,000 $159,456 $159,456 31.0% 38.7%
$270,000 $163,356 $163,356 31.9% 39.5%
$280,000 $167,091 $167,091 32.7% 40.3%
$290,000 $170,661 $170,661 33.5% 41.1%
$300,000 $174,065 $174,065 34.3% 42.0%

PPP Factor History

Local currency per 1 USD PPP – OECD PPP

Year PPP Factor Exchange Rate Price Level Index
2022 1.0000 N/A 100.0
2023 1.0000 N/A 100.0
2024 1.0000 N/A 100.0

Country Overview

Avg. Annual Wage
$86,977 PPP
VAT / GST Rate
0.0%
Top Income Tax Rate
50.3%

Global Minimum Tax (Pillar Two)

✗ not_started

GILTI rules exist but do not fully conform to Pillar Two

View all countries →

Data-derived peers

These links use the same OECD single-worker model at a $100K gross salary, not geographic proximity or a recommendation.

Understanding United States's Tax & Pay Landscape

United States's tax system shapes the real value of every paycheck earned in the country. At a $100K USD equivalent salary, workers keep $74,598 after income tax and social security contributions, but when adjusted for local purchasing power, that take-home pay is worth $74,598 in US dollar terms. With a top marginal income tax rate of 50.3%, a VAT/GST rate of 0.0%, the total cost of employment and the net benefit to workers varies significantly compared to other OECD nations. Use the calculator above to model your own salary scenario.

What This Pay Data Actually Means for Workers in United States

At a $100K gross salary, United States delivers $74,598 in PPP-adjusted take-home pay - $22,101 below the OECD average of $96,699. The nominal net figure of $74,598 understates or overstates what that salary actually buys because a dollar in United States is not worth a dollar in the United States. The current PPP factor of 1.000 and price level index of 100.0 (US = 100) are the conversion mechanics that translate nominal pay into real living-standard units.

The top marginal income tax rate of 50.3% is only part of the picture, effective rates on typical salaries are much lower because of bracket progression, personal allowances, and family credits. At $100K, the effective income tax rate is 17.8% and employee tax plus social-security deductions are 25.4%. Employer-side social contributions add a layer of cost that does not appear on pay stubs but shifts the total cost of employment. On the spending side, a VAT/GST rate of 0.0% further reduces what each after-tax dollar ultimately purchases.

Compared to a US worker at the same $100K salary keeping $74,598 in PPP-adjusted terms, United States delivers less real purchasing power per dollar of gross pay. The national average annual wage in United States sits at $86,977 in PPP-adjusted US dollars, giving a baseline for how a $100K offer compares to typical local compensation, a premium or a discount depending on the market. The table of take-home pay and PPP factor history above shows how these forces have moved over time and at every salary level, so expat workers, remote employees, and employers can size a specific offer against the structural realities of United States's tax and price landscape.

Frequently Asked Questions

What is the income tax rate in United States?
United States has a top marginal income tax rate of 50.3%, compared with an OECD average employee tax-and-social-security deduction rate of 30.0%. At a $100K salary, the effective income tax rate is 17.8% and employee deductions (income tax plus employee social security contributions) reach 25.4%. Deductions that can lower the effective rate include standard personal allowances, employee social security contributions, and family-related credits where applicable. Use the calculator above to model your exact take-home pay at any salary level.
How does take-home pay in United States compare to other countries?
At a $100K USD equivalent salary, workers in United States keep $74,598 after income tax and social security contributions. Adjusted for local purchasing power using the PPP factor of 1.000, that take-home is worth $74,598 in real US dollar terms - $22,101 below the OECD average of $96,699. Compared to the United States ($74,598 PPP-adjusted), workers in United States get less real purchasing power per dollar earned. With a price level index of 100.0 (US = 100), higher local prices reduce what each dollar buys.
Does United States have a VAT or sales tax?
Yes, United States levies a VAT/GST rate of 0.0%, which applies to most goods and services on top of income taxes. Many countries apply reduced rates to essentials like food, healthcare, and education. This consumption tax is not reflected in the take-home pay figures above, but it significantly affects real purchasing power, a 0.0% VAT means a relatively low additional cost compared to high-VAT European countries. The PPP factor already accounts for local price differences (including VAT effects) when converting take-home pay to real purchasing power.
What is purchasing power parity (PPP) and why does it matter for United States?
Purchasing power parity adjusts nominal salary figures to reflect what money actually buys in United States versus the United States. United States's PPP factor is 1.000, meaning local prices are about 0% higher than the US, reducing the real value of each dollar earned. Without the PPP adjustment, United States's salaries would appear more competitive than they actually are in day-to-day terms. The OECD PPP provides the conversion factors used here.
How much does an employer pay on top of salary in United States?
Employer social security contribution rates in United States vary by income level and program. These costs, which fund pensions, healthcare, and unemployment insurance, are invisible on a pay stub but increase the total cost of employment significantly. The OECD tax wedge includes employer contributions as well as income tax and employee social security contributions. This page's 25.4% employee deduction rate at a $100K salary excludes employer contributions, so it describes what leaves the worker's gross pay rather than the full employer cost.
How do I send money to or from United States?
International money transfers to United States (USD) involve exchange rate margins, transfer fees, and processing time that vary by provider. The PPP factor and exchange rate shown above help estimate the real value of remittances, a dollar sent from the US may buy fewer goods in United States than at home. Use the PPP-adjusted take-home figures above to estimate what those funds are worth in local terms.
What is the difference between the effective tax rate and employee deductions in United States?
The effective income tax rate counts only income tax as a share of gross pay. The employee deduction rate adds employee social-security contributions, so it better reflects what leaves a paycheck. Both are shown above for a $100K salary in United States; the gap between them is the employee social-security share. The OECD tax wedge is broader because it also includes employer contributions.
What deductions or credits lower the effective tax rate in United States?
The effective rate shown for United States already reflects the standard deductions in the OECD Taxing Wages model: the basic personal allowance, deductible employee social-security contributions, and family-related credits where they apply. Individual circumstances such as additional dependents or country-specific reliefs can lower the rate further; the figures here use the OECD stylized single-worker case.
How does family status change take-home pay in United States?
Like every OECD member, United States adjusts take-home pay for family circumstances. A single worker with no children typically faces the highest effective rate, while a married single-earner couple with two children usually pays less because of child credits and spousal allowances. PlainGlobalPay models three OECD family types at every salary level.

Compare United States with a regional peer

Understand these figures

Download the full OECD dataset (CSV) Open the dataset (JSON) Dataset method and citation
Embed this country data card

Reuse the source-bounded OECD comparison card with a visible PlainGlobalPay attribution. The card is not personal tax advice.

Preview the embeddable card

Disclaimer: This information is provided for informational purposes only and does not constitute professional advice. Data is sourced from the OECD Taxing Wages database. Consult a qualified professional before making decisions based on this data.